Spotify Music Chart Trend Analysis
- reikakfujimura
- Apr 11, 2022
- 5 min read
Updated: Apr 12, 2022

Spotify offers amazing analytical tools that are available for free. In this article I will summarize the results of my music trend analysis using the Python library of the Spotify Web API (spotipy). I clustered the top Spotify songs into 3 vibes and created the playlists.
Full source code is also available here!
Table of Contents
Data Collection
Analysis
Clustering and Analysis
Conclusion
Data Collection
There is a wonderful dataset of Spotify's top chart data by Dhruvil Dave available on Kaggle. In this work I used this dataset, Spotify's weekly top 200 chart.
preprocess.py
import pandas as pd
pd.read_csv("charts.csv", nrows=5)
The dataset contains information about weekly top 200 chart songs in all regions in the world. It includes title, rank (from 1 to 200), date, artist name, track url, country, and streams volumes.
Using track url, I connected the dataset with music features which are offered by the Python library for the Spotify Web API (spotipy).
If you want to explore more, you can learn details of spotipy here!
To use Spotify API, first you need to register Spotify for developers and get tokens. After registration, set the token as the environmental variables.
preprocess.py
os.environ['SPOTIPY_CLIENT_ID'] = Client_ID
os.environ['SPOTIPY_CLIENT_SECRET'] = Client_Secret
Then request the music features with track url, and get a result in dictionary format.
preprocess.py
import spotipy
from spotipy.oauth2 import SpotifyClientCredentials

auth_manager = SpotifyClientCredentials()
sp = spotipy.Spotify(auth_manager=auth_manager)
d = sp.audio_features(url)[0]
After converting dictionary to pandas dataframe, our data look like this.
df.head()
Acousticness: A measure of whether the track is acoustic.
Danceability: Describes how suitable a track is for dancing.
Energy: Represents a perceptual measure of intensity and activity.
Instrumentalness: Predicts whether a track contains no vocals.
Liveness: Detects the presence of an audience in the recording.
Speechiness: Detects the presence of spoken words in a track.
Tempo: The overall estimated tempo of a track in beats per minute (BPM).
Valence: Describes the musical positiveness conveyed by a track.
Analysis
Time-series variation of the average of each feature in US top200 songs
First, time-series variation of the average music features in the US top 200 chart songs is visualized (from 2018 to 2022).
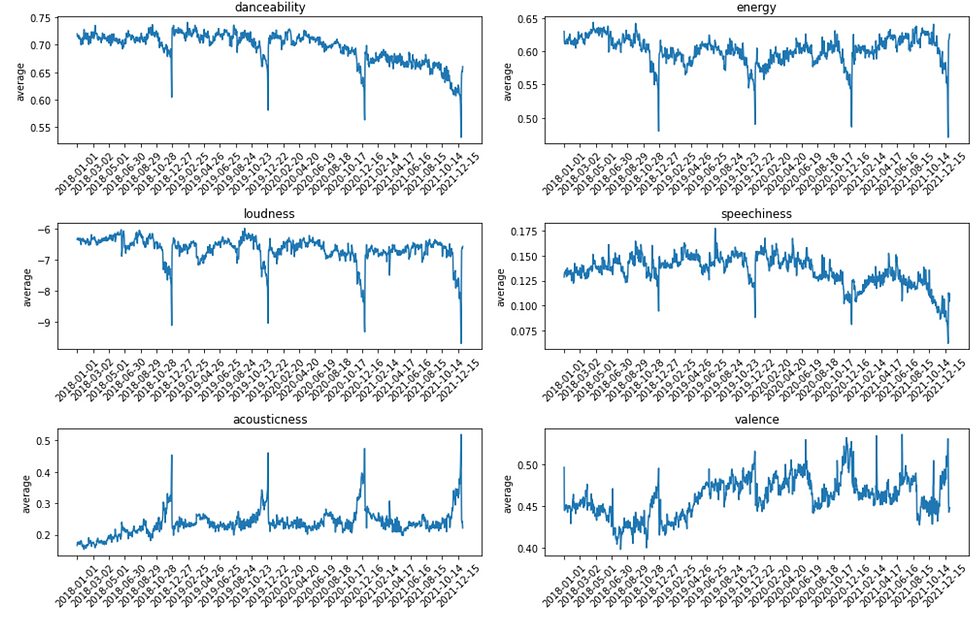
These plots show a strong yearly trend around Christmas. Every winter, features such as danceability, energy, loudness, speechiness start to decrease about one month before the Christmas day. They steeply drop on the Christmas day, and quickly return to the original level after that day. The opposite is true for acousticness; it shows a sharp peak on the Christmas day. This suggests that the impact of Christmas is extraordinary large in US.
Here is an interesting analysis by Ewoud Brouwer, about the impact of Christmas across the countries.
There are other features with different trends such as valence. Valence, which represents happiness, increases around October and April, but there might be other (not seasonal) causes for these waves.
Comparison of US and Canada: Distribution of top200 songs' features
Secondly, distributions of these music features are visualized and compared between countries. Here, let's compare the data of US and Canada (2020).
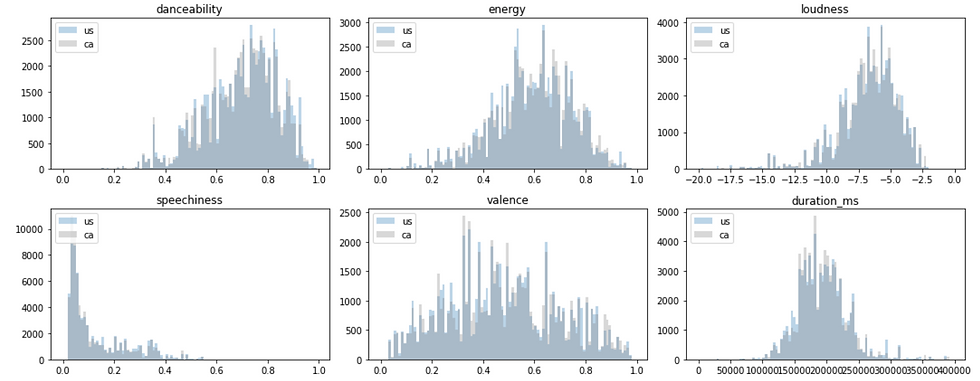
Trends of US and Canada are quite similar, which is understandable because US and Canadian top chart often have same songs in common.
Comparison of US and Japan: Distribution of top200 songs' features
Next, see what happens if we compare the data of US and Japan (2020).
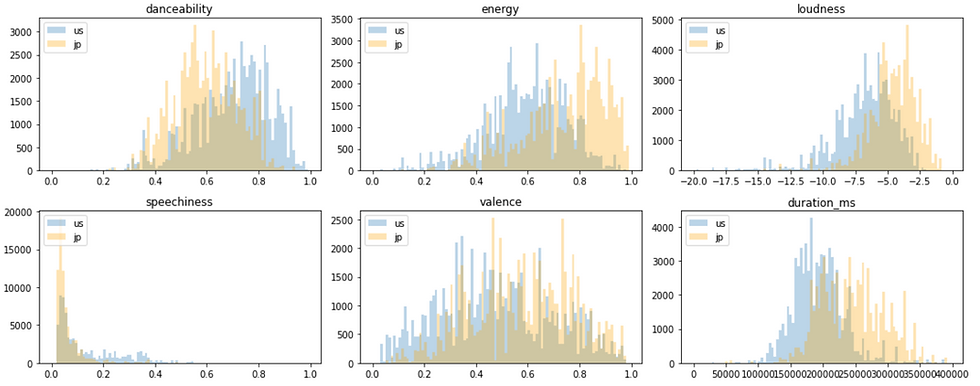
Unlike the case of US and Canada, the trend of US and Japan are totally different. Top 200 most-listened songs in Japan tend to have less danceability, more energy, more loudness, less speachness, more variance, and longer duration time. There might be a lot of causes for this, but one hypothesis is the difference of music culture. For example, karaoke is a popular place to enjoy music in Japan while US has a culture of enjoying dancing with music. This may result in higher danceability in US.
If an artist wants to make a great hit in another country, translating languages is obviously not enough: it seems to be important to understand which sound is considered to be more comfortable for listeners in different countries.
Clustering
Next, let's decompose the top chart songs into small categories and see how these overall trends are created.
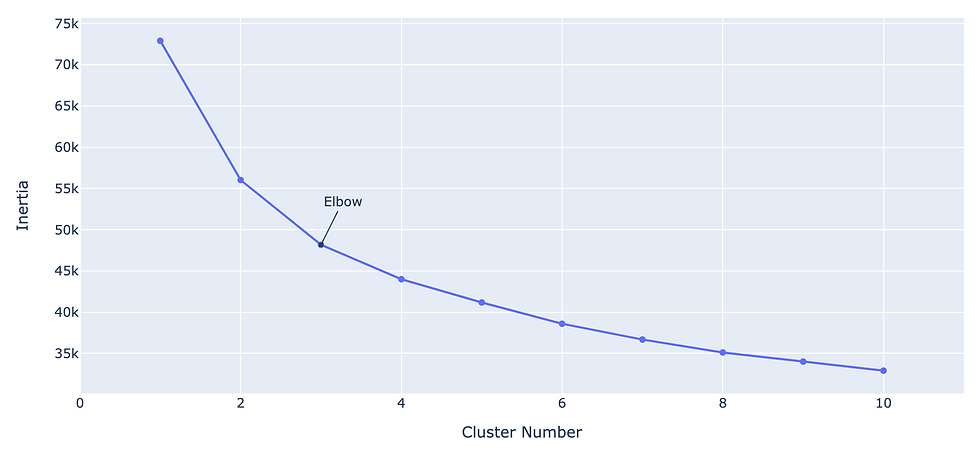
Here, US Songs are separated into 3 groups using k-means clustering method.
Number of clustering classes is decided using elbow method. Elbow method finds the best number of groups by repeating clustering calculation with several number of classes. In the graph below, I plot inertia (sum of squared error for each cluster from centroid, which tells us how dense clusters are) and find the optimal number of clusters.
results.ipynb
# elbow method

scaler = MinMaxScaler()
scaler.fit(X_fit)
X_scaler=scaler.transform(X_fit)
inertia = []
for i in range(1,11):
    kmeans = KMeans(
        n_clusters=i, init="k-means++",
        n_init=10,
        tol=1e-04, random_state=42
    )
    kmeans.fit(X_scaler)
    inertia.append(kmeans.inertia_)
fig = go.Figure(data=go.Scatter(x=np.arange(1,11),y=inertia))
fig.update_layout(title="Inertia vs Cluster Number",xaxis=dict(range=[0,11],title="Cluster Number"),
                  yaxis={'title':'Inertia'},
                 annotations=[
        dict(
            x=3,
            y=inertia[2],
            xref="x",
            yref="y",
            text="Elbow",
            showarrow=True,
            arrowhead=7,
            ax=20,
            ay=-40
        )
    ])
Now, we apply k-means clustering.
results.ipynb
# k-means clustering
n_clusters=3
kmeans = KMeans(n_clusters = n_clusters,
                init = 'k-means++',
                n_init= 10,
                max_iter=350,
                tol=1e-04,
                random_state = 42
               )
pred_y = kmeans.fit_predict(X_fit)
The representatives of the three classes look like this.

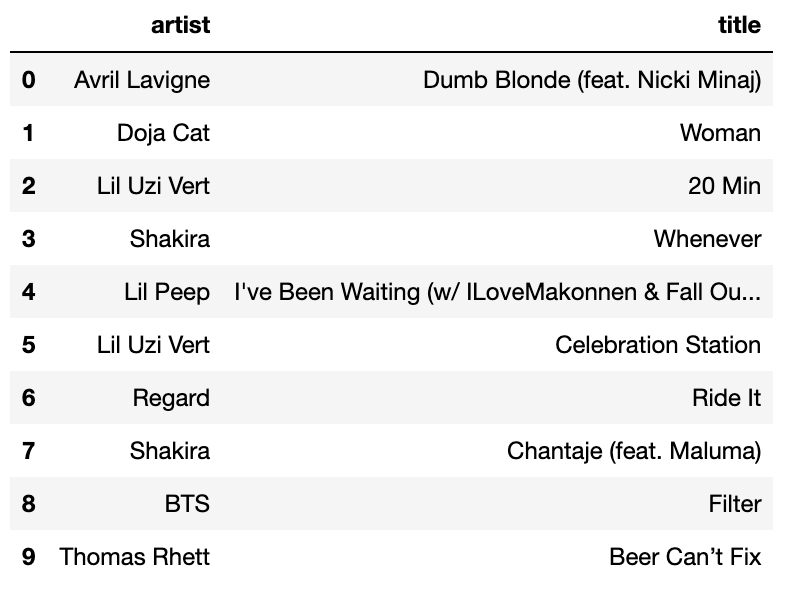

What do you think about this classification? Dose it look successful? Anyway, for me, it seems this model roughly separates the songs into three categories: class 0 seems to be a group of ballads and folks, class 1 to be a group of happy-vibe pop songs, and class 2 to be hiphop songs.
Let's visualize the average features of these three classes.
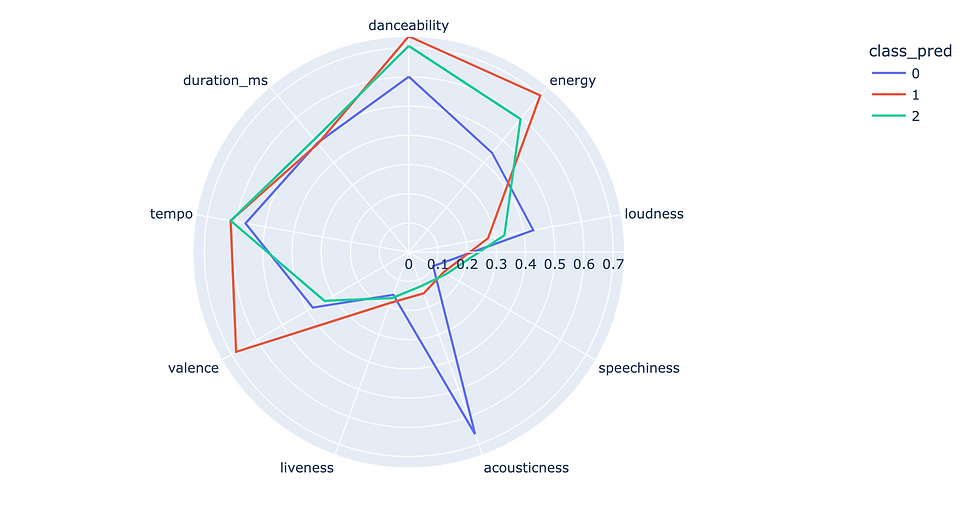
Class 0 has less danceability and energy, and high acousticness, which are the general characteristics of ballads and folks. On the other hand, class 1 has high danceability, energy and valence (valence represents happiness). Class 2 is somewhat difficult, but it has low valence while it has relatively high danceability and tempo at the same time.
Lastly, let's see how these three classes are replaced in top 200 charts over time.
The graph below is the time-series variation of the number of the songs in each class in US top 200 chart.
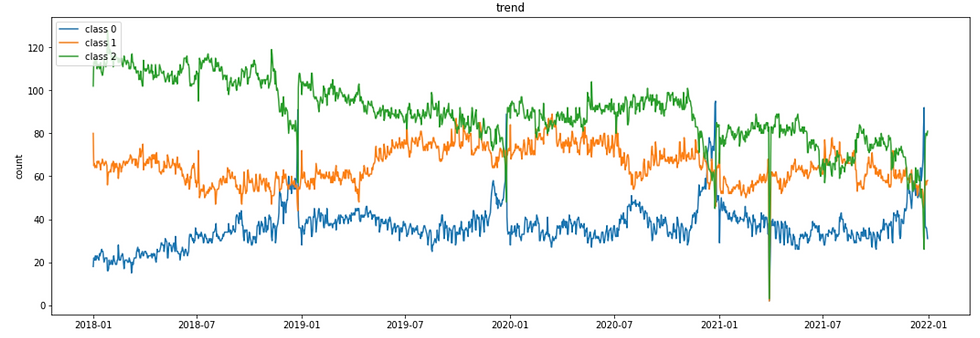
From yearly trend, we can see that Christmas songs belong to class 0. Deciding the release date of a new Christmas song will be an essential issue for artists because it will largely change the streaming volume. In relation to Christmas trend, it is also interesting that only class 2 is replaced by class 0 in Christmas season.
Regarding overall trend, the share of class 2 gradually decreased from 2018 to 2022.
Class 0 has many large waves. It might be possible that class 0 has big artists who make a huge trend with one album.
Conclusion
In summary, Spotify's top 200 chart songs are analyzed using spotipy, a Python library of the Spotify Web API.
Time-series variation of music features in US top200 songs shows some yearly trends of top-hit tracks. Especially, it shows a large impact of Christmas in US. When the average of these features are compared to other countries, US shows similar trend with Canada but shows totally different trends with Japan. This might be caused by the differences in music listening habits.
Lastly, the songs are grouped into 3 classes using k-means clustering. When seasonal trends of music features are analyzed, these three classes show different yearly trends. Further analysis and clustering will give us insights of new music trends and genre in top chart songs.
I like Spotify because it offers a rapid development opportunity for new lesser-known songs. The best solution is to buy spotify monthly listeners: https://rocketfame.net/product-category/spotify-promotion/spotify-listeners/